It’s lost on no one that the past year was one of the craziest years in the housing market since who knows when… and it continues today. A lot has been written about what has been going on, so I am not going to get into a bunch of statistics (well, maybe a couple). Instead, I want to take a more global view of how the current housing trends came to be and what may keep them going and what may cool things off.
Pre-Pandemic Housing Trends
Many tie the underlying strength in the housing market prior to the COVID crisis to the generation of “millennials” feeling the urge to build a household, maybe start a family, getting tired of apartments and roommates, etc. This generation of people are considered by the Census Bureau to have been born between 1982-2000 putting them between 21 years old and 39 years old. Combine that with the fact homebuilders sharply curtailed activity post the financial crisis in 2008-2010 from a multi-decade trend (80’s, 90’s and 2000’s) of 41,000 new homes constructed per one million people to only 21,000 per one million people for the 2010 decade.
So, it just comes down to a supply/demand problem. Millennials were already facing this problem pre-pandemic that began to accelerate rising home prices back in 2016-2017.
Pandemic Times
Drivers of demand are easy to understand. Most obvious is the shift to remote work as well as the need for more space and people opting to move from urban to suburban locations. Throw in historically low interest rates, high liquidity, and record high household net worth and here we are. With the virus refusing to die, housing choices haven’t really changed, keeping the demand for homes high.
The decline in housing starts over the past decade accelerated as the pandemic took hold. Supply disruptions impacted the availability of lumber causing lumber futures prices to skyrocket up from roughly $400 to as high as $1,700 per contract in a matter 12 months. Prices have since settled down to between $400-$500 per contract. Other commodities like copper also saw huge spikes in prices and have remained elevated over ongoing global supply issues.
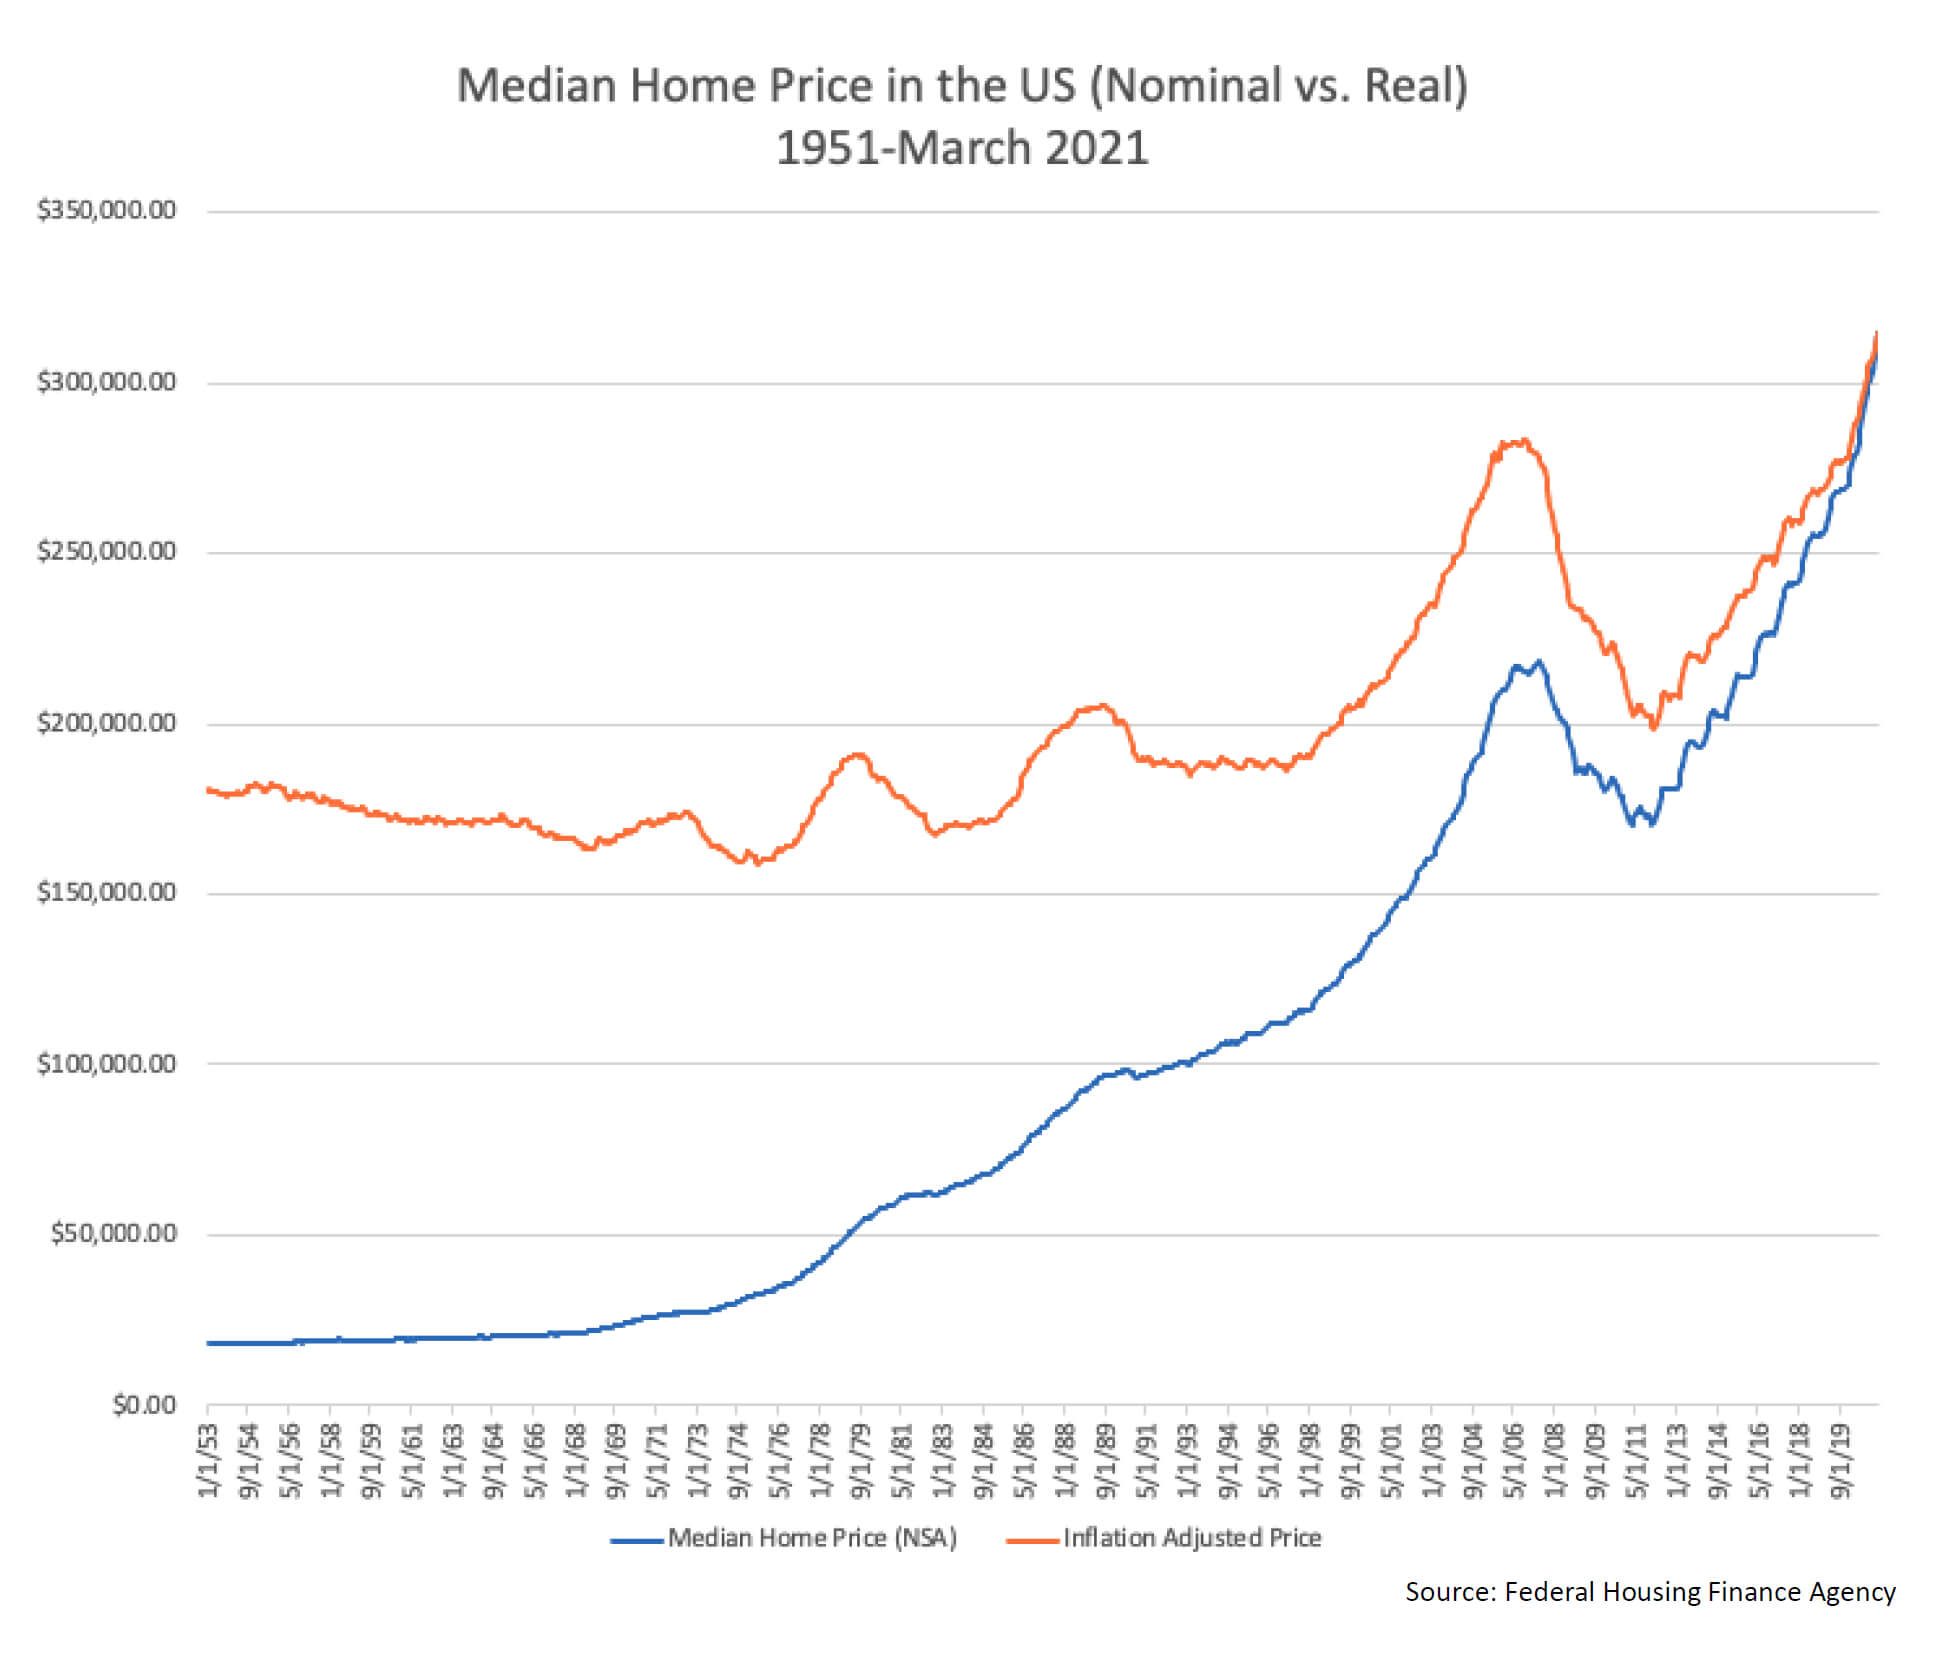
The chart below illustrates just how sharp the rise in housing prices has been over the past several years topped off by a near vertical spike over the past 18 months. The orange line shows prices adjusted for inflation which as you can see, remained largely stable up until 1999. The surge that followed was the lead up to the global financial crisis. When the crisis hit, you can see how damaging it was to home prices. The question is will we experience a similar decline once supply imbalances are smoothed out?
Post-Pandemic Times (eventually)
The expectations that the surge in home values nationwide will continue are low. The sheer volume of home sales nationwide has slowed, albeit only a little. We would not be surprised to see sales and/or prices continue to slowly come off the boil; housing affordability remains generally healthy, and mortgage rates remain historically low. Were home prices to resume their ascent higher, or mortgage rates begin to creep higher, housing affordability would likely suffer. What is likely though in the near-to-medium term is for building activity to accelerate in the interest of boosting inventories to meet demand.
I do not believe at all that we will have a recurrence of the fall in home prices seen post the financial crisis. Our financial system is very well capitalized and the wildly loose lending practices that were largely responsible for the financial crisis are simply no more, which means the risks of widespread mortgage delinquencies are low. And the tighter lending requirements on home equity lines of credit have limited the number of borrowers who can tap the new found equity in their homes. That has led to a significant reduction in the number of underwater mortgages thus improving the financial picture of many homeowners across the country.
Where Have Prices Risen the Most?
For fun, I thought it would be interesting to look at where home prices increased the most. The National Association of Realtors regularly releases quarterly data on home prices in the US. They released second quarter data earlier this month. The median sales price for single-family existing homes was higher in the second quarter compared with a year ago for 182 of the 183 metro the association said. In 94% of those metro areas, median prices rose by more than 10% from a year earlier. Springfield, IL is the only metro area that saw a decline in home prices of 7%. Nationwide, the median single-family existing-home sales price rose 22.9% in the second quarter to $357,900 from a year ago, a record in data going back to 1968.
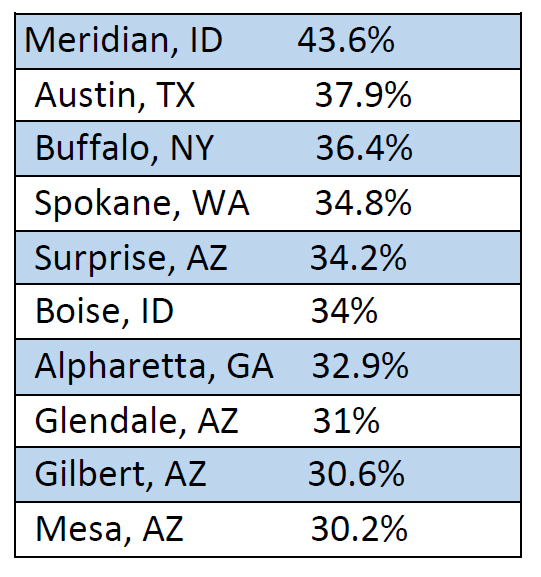
The Top 10 cities with the largest percentage increase in home prices as of second quarter 2021 compared to the second quarter of 2020:
Wrapping Up
As mentioned above, the rise in home values is slowing and may soon rollover in some regions as demand fades and supply increases. How much certain regions may correct is of course hard to predict. It isn’t too off base to suggest that some buyer’s remorse may develop with those who paid so much over asking prices. Also, I am sure that for some, the realization of the responsibilities and costs that come along with owning a home are a whole lot different than renting and letting someone else be responsible for maintenance, repairs, property taxes, etc.
If asked, we would recommend that folks take their time when looking for a home and don’t waive inspections and other diligence just because the competing buyer is willing to making you fear you may lose the property. Those are risks that no one should be taking. If anyone is looking to buy a home in the near future, know that we are here to help review and advise on opportunities you may come across.